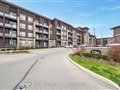
2035 Appleby Line 103
$513,466
Comparative Market Analysis
Apr 25, 2024
NOT AN ACTIVE LISTING
Historical Performance
| Period | $ Change | % Change |
| 1 Day | +$297 | +0.058% |
| 7 Days | +$283 | +0.055% |
| 30 Days | +$8 | +0.002% |
| 3 Months | -$1,020 | -0.198% |
| 6 Months | +$6,810 | +1.34% |
| 1 Year | -$24.0k | -4.46% |
| 3 Years | +$90.3k | +21.3% |
| 5 Years | +$163k | +46.6% |
| 10 Years | +$295k | +135% |
List My Property
Real Estate Statistics
Financing Solutions
AS SEEN ON


Are You a Licensed Real Estate Agent or Broker?