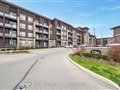
2035 Appleby Line 201
$606,017
Comparative Market Analysis
Apr 19, 2024
NOT AN ACTIVE LISTING
Historical Performance
| Period | $ Change | % Change |
| 1 Day | +$350 | +0.058% |
| 7 Days | +$300 | +0.050% |
| 30 Days | -$157 | -0.026% |
| 3 Months | -$1,772 | -0.292% |
| 6 Months | +$6,782 | +1.13% |
| 1 Year | -$31.5k | -4.94% |
| 3 Years | +$95.5k | +18.7% |
| 5 Years | +$162k | +36.5% |
| 10 Years | +$291k | +92.5% |
List My Property
Real Estate Statistics
Financing Solutions
AS SEEN ON


Are You a Licensed Real Estate Agent or Broker?