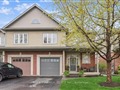
1048 Ryckman Common
$960,181
Comparative Market Analysis
May 6, 2024
NOT AN ACTIVE LISTING
Historical Performance
| Period | $ Change | % Change |
| 1 Day | +$475 | +0.049% |
| 7 Days | +$1,155 | +0.120% |
| 30 Days | -$579 | -0.060% |
| 3 Months | -$1,692 | -0.176% |
| 6 Months | +$18.1k | +1.92% |
| 1 Year | -$33.9k | -3.41% |
| 3 Years | +$197k | +25.9% |
| 5 Years | +$314k | +48.6% |
| 10 Years | +$549k | +134% |
List My Property
Real Estate Statistics
Financing Solutions
AS SEEN ON

Are You a Licensed Real Estate Agent or Broker?