SALES HISTORY
MARKET STATS
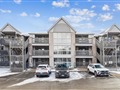
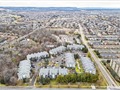
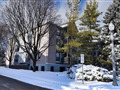
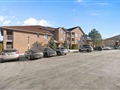
PROPERTY DESCRIPTION
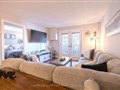
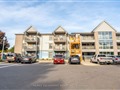
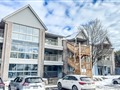
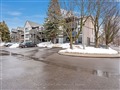
2020 Cleaver Ave 204 is a 1-bedroom 1-washroom condo apartment located in Headon community of Burlington. It is currently NOT FOR SALE, but is
worth in our opinion around $517,836
.
2020 Cleaver Ave 204 is currently not for sale and is not an active listing on Listing.ca.
NEARBY SCHOOLS
Burlington Montessori Preschool
5.0 km
2111 Walker's Line, L7R3X5
Phone: (905) 332-1175
Halton District School Board
0.0 km
1406 Pine Glen, L6M4C2
Phone: (905) 469-0341
Halton District School Board
2.8 km
1551 Pilgrims Way, L6M2W7
Phone: (905) 825-9808
Halton Waldorf School
5.0 km
2193 Orchard Rd, L7R3X5
Phone: (905) 331-4387
Summerhill
9.4 km
2160 Headon Rd, L7M3W7
Phone: (905) 335-9908
NEARBY SHOPPING CENTRES
Riocan Property Service
9.2 km
3505 Upper Middle Rd, L7M4C6
Phone: (905) 335-4625
NEARBY GROCERY STORES
FreshCo
9.2 km
3505 Upper Middle Rd, L7M4C6
Phone: (905) 315-9104
No Frills
3.2 km
1395 Abbeywood Dr, L6M3B2
Phone: (416) 234-2068
NEARBY PHARMACIES
Shoppers Drug Mart
9.2 km
3505 Upper Middle Rd, L7M4C6
Phone: (905) 319-3333
NEARBY BARS AND PUBS
Jack Astor's Bar and Grill
11.4 km
3140 South Service Rd, L7N3J3
Phone: (905) 235-7227
NEARBY COFFEE SHOPS
Tim Hortons
5.0 km
1900 Walkers Line, L7R3X5
Phone: (905) 331-1426
NEARBY BANKS
Scotiabank
9.2 km
3505 Upper Middle Rd, L7M4C6
Phone: (905) 332-2282
TD Canada Trust
8.6 km
2931 Walker's Line, L7M4M6
Phone: (905) 332-3550
NEARBY HEALTH AND FITNESS FACILITIES
Curves
9.2 km
3505 Upper Middle Rd, L7M4C6
Phone: (905) 319-9700
NEARBY LIQUOR STORES
The Wine Shop
9.2 km
3505 Upper Middle Rd, L7M4C6
Phone: (905) 336-9101