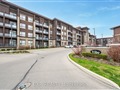
2055 Appleby Line 204
$525,286
Comparative Market Analysis
May 1, 2024
NOT AN ACTIVE LISTING
Historical Performance
| Period | $ Change | % Change |
| 1 Day | +$304 | +0.058% |
| 7 Days | +$337 | +0.064% |
| 30 Days | +$249 | +0.047% |
| 3 Months | -$234 | -0.044% |
| 6 Months | +$8,740 | +1.69% |
| 1 Year | -$20.0k | -3.67% |
| 3 Years | +$108k | +25.9% |
| 5 Years | +$172k | +48.7% |
| 10 Years | +$296k | +129% |
List My Property
Real Estate Statistics
Financing Solutions
AS SEEN ON


Are You a Licensed Real Estate Agent or Broker?