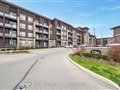
2065 Appleby Line 112
$600,829
Comparative Market Analysis
Apr 26, 2024
NOT AN ACTIVE LISTING
Historical Performance
| Period | $ Change | % Change |
| 1 Day | +$347 | +0.058% |
| 7 Days | +$338 | +0.056% |
| 30 Days | +$46 | +0.008% |
| 3 Months | -$1,080 | -0.179% |
| 6 Months | +$8,191 | +1.38% |
| 1 Year | -$27.6k | -4.39% |
| 3 Years | +$108k | +21.8% |
| 5 Years | +$180k | +42.8% |
| 10 Years | +$311k | +107% |
List My Property
Real Estate Statistics
Financing Solutions
AS SEEN ON


Are You a Licensed Real Estate Agent or Broker?