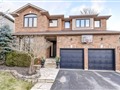
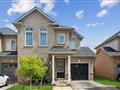
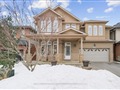
2065 Newell Cres
$1,510,086
Comparative Market Analysis
Jun 16, 2025
NOT AN ACTIVE LISTING
Historical Performance
| Period | $ Change | % Change |
| 1 Day | +$437 | +0.029% |
| 7 Days | +$277 | +0.018% |
| 30 Days | -$2,762 | -0.183% |
| 3 Months | -$4,933 | -0.326% |
| 6 Months | +$23.5k | +1.58% |
| 1 Year | -$73.0k | -4.61% |
| 3 Years | +$251k | +19.9% |
| 5 Years | +$448k | +42.2% |
| 10 Years | +$839k | +125% |
List My Property
Real Estate Statistics
Financing Solutions
Browsing History
5226 Autumn Harvest Way, Burlington
5 seconds ago
5020 Haswell Lane, Burlington
10 seconds ago
AS SEEN ON


Are You a Licensed Real Estate Agent or Broker?