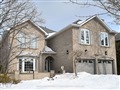
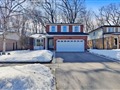
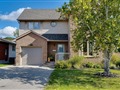
2066 Trillium Crt
$2,024,169
Comparative Market Analysis
Jun 14, 2025
NOT AN ACTIVE LISTING
Historical Performance
| Period | $ Change | % Change |
| 1 Day | +$596 | +0.029% |
| 7 Days | +$283 | +0.014% |
| 30 Days | -$4,226 | -0.208% |
| 3 Months | -$8,452 | -0.416% |
| 6 Months | +$27.7k | +1.39% |
| 1 Year | -$106k | -4.99% |
| 3 Years | +$302k | +17.5% |
| 5 Years | +$539k | +36.3% |
| 10 Years | +$1.11m | +122% |
List My Property
Real Estate Statistics
Financing Solutions
Browsing History
3198 Twin Oaks Cres, Burlington
2 seconds ago
4750 Deforest Cres, Burlington
3 seconds ago
1205 Hammond St, Burlington
4 seconds ago
2093 Mountain Grove Ave, Burlington
4 seconds ago
AS SEEN ON

Are You a Licensed Real Estate Agent or Broker?