SALES HISTORY
MARKET STATS
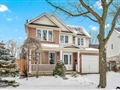
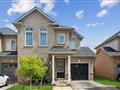
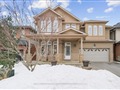
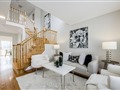
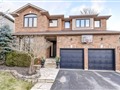
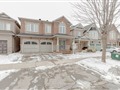
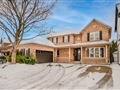
PROPERTY DESCRIPTION
2089 Newell Cres is a 3-bedroom 3-washroom detached house located in Orchard community of Burlington. It is currently NOT FOR SALE, but is
worth in our opinion around $1,496,241
.
The property is situated on a 40' frontage by 85' deep lot. 2089 Newell Cres is currently not for sale and is not an active listing on Listing.ca.
NEARBY SCHOOLS
Burlington Montessori Preschool
1.0 km
2111 Walker's Line, L7R3X5
Phone: (905) 332-1175
CSDCSO
0.9 km
2155 Birchleaf Lane, L7L6G8
Phone: (905) 331-6044
Halton Catholic District School Board
0.8 km
2400 Sutton Dr, L7L7N2
Phone: (905) 335-7553
Halton Waldorf School
1.0 km
2193 Orchard Rd, L7R3X5
Phone: (905) 331-4387
NEARBY SHOPPING CENTRES
Millcroft Shopping Centre
1.1 km
2020 Appleby Line, L7L6M6
Phone: (905) 319-9774
NEARBY PHARMACIES
Metro Pharmacy
1.1 km
2010 Appleby Line, L7L6M6
Phone: (905) 331-0060
Shoppers Drug Mart
1.1 km
2080 Appleby Line, L7L6M6
Phone: (905) 332-8787
NEARBY RESTAURANTS AND CAFETERIAS
Asano Sushi
1.1 km
2020 Appleby Line, L7L6M6
Phone: (416) 266-4533
NEARBY COFFEE SHOPS
Coffee Culture
1.1 km
1960 Appleby Line, L7L6M6
Phone: (905) 335-0050
Delymark Cafe
2.1 km
1100 Burloak Dr, L7L6B2
Phone: (905) 874-1515
Tim Hortons
1.0 km
1900 Walkers Line, L7R3X5
Phone: (905) 331-1426
Williams Coffee Pub
1.1 km
2070 Appleby Line, L7L6M6
Phone: (905) 319-0968
NEARBY BANKS
TD Canada Trust
3.2 km
2931 Walker's Line, L7M4M6
Phone: (905) 332-3550
TD Canada Trust
1.1 km
G1-2000 Appleby Line, L7L6M6
Phone: (905) 332-2240
NEARBY LIQUOR STORES
LCBO
1.1 km
1F-2000 Appleby Line, L7L6M6
Phone: (905) 336-6200