($title)
($content)
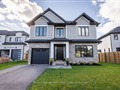
221 Appleby Line
$1,775,051
Comparative Market Analysis
Apr 26, 2024
NOT AN ACTIVE LISTING
Historical Performance
| Period | $ Change | % Change |
| 1 Day | +$466 | +0.026% |
| 7 Days | +$61 | +0.003% |
| 30 Days | -$4,075 | -0.229% |
| 3 Months | -$7,668 | -0.430% |
| 6 Months | +$24.6k | +1.40% |
| 1 Year | -$93.6k | -5.01% |
| 3 Years | +$336k | +23.4% |
| 5 Years | +$489k | +38.1% |
| 10 Years | +$982k | +124% |
List My Property
Request Sold History
Real Estate Statistics
Financing Solutions
AS SEEN ON

FOR SALE
FOR RENT
LIST PROPERTY FOR SALE
Property Type
Barrie 658
Brampton 1.26k
Burlington 422
Alton 54
Appleby 38
Brant 96
LaSalle 43
Roseland 29
see all
Hamilton 1.27k
Kawartha Lakes 504
London 436
Markham 609
Mississauga 1.42k
Niagara Falls 328
Oakville 675
Oshawa 412
Richmond Hill 673
Toronto 7.38k
Vaughan 867
Bedrooms
Bathrooms
Search Listings
Save Graph
How is this Graph Generated?
GRAPH AND COMPARATIVE MARKET ANALYSIS (CMA) METHODOLOGY
The CMA graph for 221 Appleby Line is based on Burlington 365-day running median for 3+1-bedroom, 3-bathroom
detached house properties and adjusted for sold comparables in the area. This CMA does not reflect recent home improvements that may have been done to this property.
The CMA represents a seasonally adjusted long term valuation trends and may not immediately reflect short term market fluctuations. If you are interested in raw
monthly real estate market statistics and short term market fluctuations, please refer to
real estate statistics for Burlington.
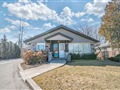
SIMILAR PROPERTIES FOR SALE
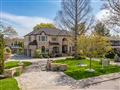
Exceptional home! This custom-built home is only 2 years new and sits in the highly sought-after Shoreacres neighbourhood. This 2-storey home is 3+1...
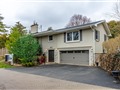
Suburban bliss perfect for families, meticulously updated 3 bdrm, 2 bath home. Boasting over 1500 sqft of living space, added by smooth ceilings...
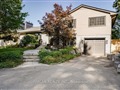
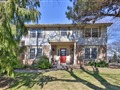
*** G O R G E O U S *** Immaculate, Don't Miss Out! Great Family Home Situated On Quiet Street. Incredible, S P O T L E S S & Beautiful 3+1...

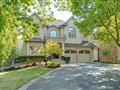
Welcome to 4189 Inglewood Drive in Burlington's highly coveted Shoreacres neighbourhood and located within the Tuck/Nelson school district. With just...
Every once in a while an exceptional property comes on the market that simply is not like the others. This stunning bungalow in coveted Shoreacres...
Note this home is a zoned commercial with a potential to convert back into residential. Renovations Have Been Done To The Entire House To Create An...
Truly a rare find! This south-facing, beautifully renovated Bungalow on the South side of Lakeshore Rd has a bright floor plan with a lower-level...
Step inside to discover a beautifully renovated space With meticulous attention to detail, Situated In Shoreacres Neighborhood. 4 Functional Bedrooms...
Fabulous 3265 sqft custom quality in prime Shoreacres. Professionally landscaped mature lot with inground pool, waterfall, gazebo. Recent Misani...
OPEN HOUSE SUNDAY APRIL 14 TH, 1 TO 4 PM. Elegant Custom-Built Home. 6,750 Square Feet, This Exquisite Property Is Not To Be Missed! A Must See! One...
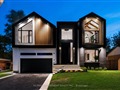
A masterpiece of modern luxury living! Located on a large lot in South Burlington this brand new customhome combines innovative design w/opulent...
Nestled in the desirable Shoreacres area of south Burlington, this 4 bedroom home has 3,589sqft of living space and is tucked away on a corner lot...
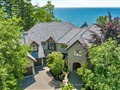
World Class Lakefront Estate On 1 Acre. White Stone English Manor W/120' Waterfront, Seawall & 30' Dock W/Boat Hoist. $4M Reno In 2016-17 Designed By...
3+1
BEDROOMS
3
BATHROOMS
1
KITCHENS
ADDRESS
PROPERTY TYPE
Detached House
LOT SIZE74.00 x 140.00
STATUSNOT AN ACTIVE LISTING
COMPARATIVE MARKET ANALYSIS
$1,775,051
Refinance Your Property
Comparative Market Analysis of 221 Appleby Line is based on market trends for Shoreacres community of Burlington community and recent sales in the area.
The sold statistics information is provided by Toronto Real Estate Board (Reference: Competition Bureau vs. TREB in Federal Court of Appeal - 27 April, 2016;
TREB's appeal was dismissed and it is now mandated to provide sold data to the public).
Comparative Market Analysis is provided for reference purposes only and may be
different from the actual market sold price or an appraised value. Comparative Market Analysis does not take into account recent home improvements that have been
carried out to the property. Listing.ca does not bare any responsibility to the accuracy of the provided opinion. The graph represents a seasonally
adjusted long term valuation trends and may not immediately reflect short term market fluctuations.
SALES HISTORY
SOLD COMPARABLES
MARKET STATS
XX/XX/20XX
SOLD
$X,XXX,000
Request Sold History
3+1 Beds
3 Baths
Sold Price
$1,375,000
List Price
$1,425,900
Sold Date
02/10/2024
DOM
XX Days
3 Beds
3 Baths
Sold Price
$1,202,000
List Price
$974,900
Sold Date
05/22/2023
DOM
XX Days
3+1 Beds
3 Baths
Sold Price
$2,100,000
List Price
$2,375,000
Sold Date
12/16/2023
DOM
XX Days
3+1 Beds
3 Baths
Sold Price
$1,850,000
List Price
$1,899,000
Sold Date
11/21/2023
DOM
XX Days
3+1 Beds
3 Baths
Sold Price
$1,681,049
List Price
$1,790,000
Sold Date
09/14/2023
DOM
XX Days
Request All 80 Sold Comparables
PROPERTY DESCRIPTION
221 Appleby Line is a 3+1-bedroom 3-washroom detached house located in Shoreacres community of Burlington. It is currently NOT FOR SALE, but is
worth in our opinion around $1,775,051
.
The property is situated on a 74' frontage by 140' deep lot. 221 Appleby Line is currently not for sale and is not an active listing on Listing.ca.
NEARBY SCHOOLS
The property is situated on a 74' frontage by 140' deep lot. 221 Appleby Line is currently not for sale and is not an active listing on Listing.ca.
Halton Catholic District School Board 1.9 km
4056 New St, L7L1S9
Phone: (905) 637-3810 Parkview Children's Centre 1.7 km
5451 Lakeshore Rd, L7L1E1
Phone: (905) 634-3141 Pauline Johnson Public School - Halton District School Board 1.7 km
4350 Longmoor Dr, L7L1X7
Phone: (905) 632-2492
NEARBY MEDICAL CENTRES
4056 New St, L7L1S9
Phone: (905) 637-3810 Parkview Children's Centre 1.7 km
5451 Lakeshore Rd, L7L1E1
Phone: (905) 634-3141 Pauline Johnson Public School - Halton District School Board 1.7 km
4350 Longmoor Dr, L7L1X7
Phone: (905) 632-2492
The Grange Animal Hospital 1.2 km
480 Kilarney Crt, L7L2N7
Phone: (905) 634-3877
NEARBY PHARMACIES
480 Kilarney Crt, L7L2N7
Phone: (905) 634-3877
DRUGStore Pharmacy 1.0 km
5111 New St, L7L1V2
Phone: (905) 631-0566 Rexall Drug Store 1.0 km
5061 New St, L7L1V2
Phone: (905) 637-2331 Shoppers Drug Mart 0.6 km
4524 New St, L7L2X8
Phone: (905) 482-0623
NEARBY BARS AND PUBS
5111 New St, L7L1V2
Phone: (905) 631-0566 Rexall Drug Store 1.0 km
5061 New St, L7L1V2
Phone: (905) 637-2331 Shoppers Drug Mart 0.6 km
4524 New St, L7L2X8
Phone: (905) 482-0623
Clancy's Food, Ale, Fun 2.0 km
4490 Fairview St, L7L5P9
Phone: (905) 232-2121
NEARBY COFFEE SHOPS
4490 Fairview St, L7L5P9
Phone: (905) 232-2121
Starbucks 1.0 km
101-491 Appleby Line, L7L1V2
Phone: (905) 681-2527
NEARBY BANKS
101-491 Appleby Line, L7L1V2
Phone: (905) 681-2527
BMO Bank of Montreal 1.0 km
5111 New St, L7L1V2
Phone: (905) 639-0404 CIBC 2.0 km
4490 Fairview St, L7L5P9
Phone: (905) 632-0747
NEARBY LIQUOR STORES
5111 New St, L7L1V2
Phone: (905) 639-0404 CIBC 2.0 km
4490 Fairview St, L7L5P9
Phone: (905) 632-0747
LCBO Burlington 1.0 km
5111 New St, L7L1V2
Phone: (905) 637-5049
5111 New St, L7L1V2
Phone: (905) 637-5049
Are You a Licensed Real Estate Agent or Broker?
© 2011-2024 Real Estate Bay Realty Inc, Brokerage
The information provided herein must only be used by consumers that have a bona fide interest in the purchase, sale, or lease of real estate and may not be used for any commercial or any other purpose. Information is deemed reliable but is not guaranteed accurate by TREB, Listing.ca or Real Estate Bay Realty, Brokerage.
The trademarks MLS®, Multiple Listing Service® and the associated logos are owned by The Canadian Real Estate Association (CREA) and identify the quality of services provided by real estate professionals who are members of CREA. Used under license.
Real Estate Bay Realty, Brokerage
220 Duncan Mill Road, Suite 209
Toronto, ON M3B 3J5
Phone: 416-800-1055
info@listing.ca Listing.ca on Twitter
RealEstateBay.ca on Facebook
220 Duncan Mill Road, Suite 209
Toronto, ON M3B 3J5
Phone: 416-800-1055
info@listing.ca Listing.ca on Twitter
RealEstateBay.ca on Facebook