($title)
($content)
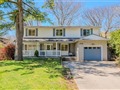
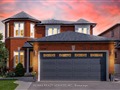
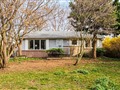
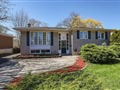
243 Appleby Line
$1,545,942
Comparative Market Analysis
Apr 25, 2024
NOT AN ACTIVE LISTING
Historical Performance
| Period | $ Change | % Change |
| 1 Day | +$462 | +0.030% |
| 7 Days | +$975 | +0.063% |
| 30 Days | +$665 | +0.043% |
| 3 Months | +$8,217 | +0.534% |
| 6 Months | +$57.5k | +3.86% |
| 1 Year | +$16.5k | +1.08% |
| 3 Years | +$494k | +47.0% |
| 5 Years | +$715k | +86.0% |
| 10 Years | +$1.04m | +206% |
List My Property
Request Sold History
Real Estate Statistics
Financing Solutions
AS SEEN ON

FOR SALE
FOR RENT
LIST PROPERTY FOR SALE
Property Type
Barrie 647
Brampton 1.25k
Burlington 419
Alton 55
Appleby 37
Brant 95
LaSalle 42
Roseland 29
see all
Caledon 324
Hamilton 1.25k
Kawartha Lakes 509
London 433
Markham 610
Mississauga 1.42k
Oakville 675
Oshawa 412
Richmond Hill 677
Toronto 7.38k
Vaughan 874
Bedrooms
Bathrooms
Search Listings
Save Graph
How is this Graph Generated?
GRAPH AND COMPARATIVE MARKET ANALYSIS (CMA) METHODOLOGY
The CMA graph for 243 Appleby Line is based on Burlington 365-day running median for 4-bedroom, 2-bathroom
detached house properties and adjusted for sold comparables in the area. This CMA does not reflect recent home improvements that may have been done to this property.
The CMA represents a seasonally adjusted long term valuation trends and may not immediately reflect short term market fluctuations. If you are interested in raw
monthly real estate market statistics and short term market fluctuations, please refer to
real estate statistics for Burlington.
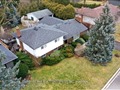
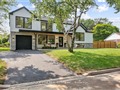
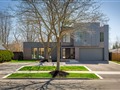
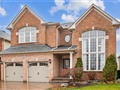
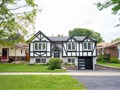
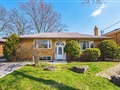
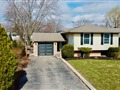
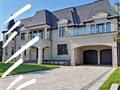
SIMILAR PROPERTIES FOR SALE
Don't miss this opportunity to own in a dream location in south Burlington's Elizabeth Gardens among luxury, upscale homes! This 4-bedroom with...
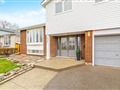
2 Car Garage (22' x 20'). An outstanding, 4 bedroom home, meticulously finished with the best, quality finishes, skilled trades people. Renovation...
Exceptional Custom-Built Home, Completed In 2023. Designed With A Modern Aesthetic & An Emphasis On Both Entertaining & Family Life. This Residence...
Ravine Home Nestled In Burlington's Finest Neighbourhood, Steps Away From The Lake. Captivating Blend Of Clean Lines & Character Makes This Modern...
Welcome to this Detach captivating home, where luxury and convenience converge to create an exceptional living experience. this home offer over 3000...
Welcome to prestigious living in the sought-after Millcroft neighborhood. This stunning home boosts4+1 bedrooms and 4.5 bathrooms, including spacious...
THIS FEELS LIKE HOME! Wonderful 5-Bedroom FOREVER Home on a LARGE newly landscaped LOT in Burlington's family-friendly Pinedale neighbourhood. The...
Location! Location! Location! Premium Corner Lot with Complete Privacy Overlooking Park with 2,080 Sq Ft Living Space. Located In the Heart of...
Attention Investors, Renovators, Builders and Buyers looking for a home to update to their liking! Welcome home to 5412 Anthony Place, a valuable...
Fully remodelled executive raised bungalow in Burlington's heart, on a tree-lined street near GO Station & Plaza. Just off QEW to Appleby Line. The...
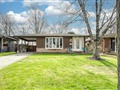
Beautiful bungalow on a private 45-foot x 170-foot lot in southeast Burlington! This 3+1 bedroom home boasts 1.5 baths and is over 1200 square feet...
Welcome to 5432 Stratton Road. This raised ranch bungalow has been owned by the same family for 60+ years. It features 1319 square feet above grade...
Beautiful Elizabeth Gardens location home! Unique raised bungalow with fully finished walkout basement, large lot backing onto a creek. 3 bedrooms on...
Spectacular Bungalow in Desirable Pinedale with 2 bedroom In-law suite with separate entrance, over 2,000 ft2 living space, SS Appliances, Quartz...
Premium Location On Enormous Lot In Se Burlington Near Lake And The Oakville Border! This Home Is Situated On A Quiet, Family Friendly Street. 2+1...
4
BEDROOMS
2
BATHROOMS
1
KITCHENS
ADDRESS
PROPERTY TYPE
Detached House
LOT SIZE78.00 x 213.00
STATUSNOT AN ACTIVE LISTING
COMPARATIVE MARKET ANALYSIS
$1,545,942
Refinance Your Property
Comparative Market Analysis of 243 Appleby Line is based on market trends for Appleby community of Burlington community and recent sales in the area.
The sold statistics information is provided by Toronto Real Estate Board (Reference: Competition Bureau vs. TREB in Federal Court of Appeal - 27 April, 2016;
TREB's appeal was dismissed and it is now mandated to provide sold data to the public).
Comparative Market Analysis is provided for reference purposes only and may be
different from the actual market sold price or an appraised value. Comparative Market Analysis does not take into account recent home improvements that have been
carried out to the property. Listing.ca does not bare any responsibility to the accuracy of the provided opinion. The graph represents a seasonally
adjusted long term valuation trends and may not immediately reflect short term market fluctuations.
SALES HISTORY
SOLD COMPARABLES
MARKET STATS
XX/XX/20XX
SOLD
$X,XXX,000
XX/XX/20XX
SOLD
$XXX,000
Request Sold History
4 Beds
2 Baths
Sold Price
$1,560,000
List Price
$1,479,900
Sold Date
02/26/2024
DOM
XX Days
4 Beds
2 Baths
Sold Price
$1,100,000
List Price
$999,800
Sold Date
01/23/2024
DOM
XX Days
4 Beds
2 Baths
Sold Price
$1,300,000
List Price
$1,299,000
Sold Date
09/25/2023
DOM
XX Days
4 Beds
2 Baths
Sold Price
$1,090,000
List Price
$1,149,000
Sold Date
07/26/2023
DOM
XX Days
4 Beds
2 Baths
Sold Price
$1,190,000
List Price
$999,000
Sold Date
07/06/2023
DOM
XX Days
Request All 109 Sold Comparables
PROPERTY DESCRIPTION
243 Appleby Line is a 4-bedroom 2-washroom detached house located in Appleby community of Burlington. It is currently NOT FOR SALE, but is
worth in our opinion around $1,545,942
.
The property is situated on a 78' frontage by 213' deep lot. 243 Appleby Line is currently not for sale and is not an active listing on Listing.ca.
NEARBY SCHOOLS
The property is situated on a 78' frontage by 213' deep lot. 243 Appleby Line is currently not for sale and is not an active listing on Listing.ca.
Brant Children's Centre 2.9 km
3180 New St, L7N1M8
Phone: (289) 812-3990 Charles Sturt University 3.3 km
860 Harrington Crt, L7N3N4
Phone: (905) 333-4955 Halton District School Board 2.9 km
3250 New St, L7N1M8
Phone: (905) 632-2944 Halton District School Board 2.9 km
3250 New St, L7N1M8
Phone: (905) 637-4009 Parkview Children's Centre 1.7 km
5451 Lakeshore Rd, L7L1E1
Phone: (905) 634-3141
NEARBY MEDICAL CENTRES
3180 New St, L7N1M8
Phone: (289) 812-3990 Charles Sturt University 3.3 km
860 Harrington Crt, L7N3N4
Phone: (905) 333-4955 Halton District School Board 2.9 km
3250 New St, L7N1M8
Phone: (905) 632-2944 Halton District School Board 2.9 km
3250 New St, L7N1M8
Phone: (905) 637-4009 Parkview Children's Centre 1.7 km
5451 Lakeshore Rd, L7L1E1
Phone: (905) 634-3141
Appleby Medical Centre 0.3 km
321 Appleby Line, L7L2X6
Phone: (905) 632-7775
NEARBY COFFEE SHOPS
321 Appleby Line, L7L2X6
Phone: (905) 632-7775
Starbucks 1.7 km
675 Appleby Line, L7L2Y5
Phone: (905) 637-7018 Tim Hortons 1.6 km
1240 Burloak Dr, L7L3X5
Phone: (289) 313-0788 Tim Hortons 18.1 km
3255 Dundas St W, L5L5V7
Phone: (905) 607-0880
675 Appleby Line, L7L2Y5
Phone: (905) 637-7018 Tim Hortons 1.6 km
1240 Burloak Dr, L7L3X5
Phone: (289) 313-0788 Tim Hortons 18.1 km
3255 Dundas St W, L5L5V7
Phone: (905) 607-0880
Are You a Licensed Real Estate Agent or Broker?
© 2011-2024 Real Estate Bay Realty Inc, Brokerage
The information provided herein must only be used by consumers that have a bona fide interest in the purchase, sale, or lease of real estate and may not be used for any commercial or any other purpose. Information is deemed reliable but is not guaranteed accurate by TREB, Listing.ca or Real Estate Bay Realty, Brokerage.
The trademarks MLS®, Multiple Listing Service® and the associated logos are owned by The Canadian Real Estate Association (CREA) and identify the quality of services provided by real estate professionals who are members of CREA. Used under license.
Real Estate Bay Realty, Brokerage
220 Duncan Mill Road, Suite 209
Toronto, ON M3B 3J5
Phone: 416-800-1055
info@listing.ca Listing.ca on Twitter
RealEstateBay.ca on Facebook
220 Duncan Mill Road, Suite 209
Toronto, ON M3B 3J5
Phone: 416-800-1055
info@listing.ca Listing.ca on Twitter
RealEstateBay.ca on Facebook