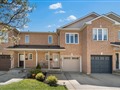
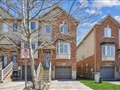
4241 Ingram Common
$845,289
Comparative Market Analysis
May 5, 2024
NOT AN ACTIVE LISTING
Historical Performance
| Period | $ Change | % Change |
| 1 Day | +$419 | +0.050% |
| 7 Days | +$912 | +0.108% |
| 30 Days | -$1,077 | -0.127% |
| 3 Months | -$3,437 | -0.405% |
| 6 Months | +$11.6k | +1.39% |
| 1 Year | -$40.9k | -4.62% |
| 3 Years | +$138k | +19.6% |
| 5 Years | +$240k | +39.6% |
| 10 Years | +$469k | +125% |
List My Property
Real Estate Statistics
Financing Solutions
AS SEEN ON


Are You a Licensed Real Estate Agent or Broker?