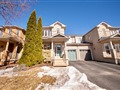
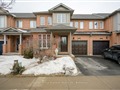
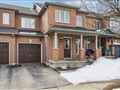
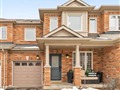
4302 Ingram Common
$805,348
Comparative Market Analysis
Jun 14, 2025
NOT AN ACTIVE LISTING
Historical Performance
| Period | $ Change | % Change |
| 1 Day | +$400 | +0.050% |
| 7 Days | +$909 | +0.113% |
| 30 Days | -$850 | -0.105% |
| 3 Months | -$2,694 | -0.333% |
| 6 Months | +$12.3k | +1.56% |
| 1 Year | -$35.9k | -4.27% |
| 3 Years | +$144k | +21.7% |
| 5 Years | +$244k | +43.4% |
| 10 Years | +$459k | +132% |
List My Property
Real Estate Statistics
Financing Solutions
Browsing History
2140 Argon Crt, Burlington
1 second ago
1369 Ester Dr, Burlington
1 second ago
927 David Crt, Burlington
1 second ago
2369 Sutton Dr, Burlington
2 seconds ago
1038 Plains View Ave, Burlington
2 seconds ago
1427 Aspen Crt, Burlington
2 seconds ago
All Properties in Grindstone, Burlington
3 seconds ago
1107 Crofton Way, Burlington
3 seconds ago
664 Montego Cres, Burlington
3 seconds ago
4747 Doug Wright Dr, Burlington
3 seconds ago
AS SEEN ON

Are You a Licensed Real Estate Agent or Broker?