SALES HISTORY
MARKET STATS
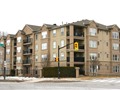
PROPERTY DESCRIPTION
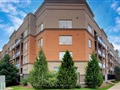
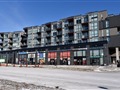
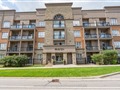
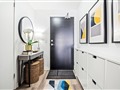
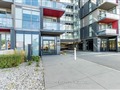
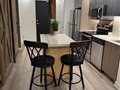
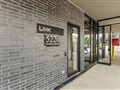
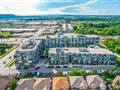
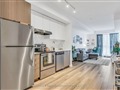
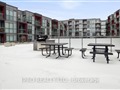
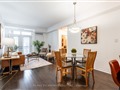
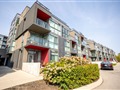
5010 Corporate Dr 313 is a 1-bedroom 1-washroom condo apartment located in Orchard community of Burlington. It is currently NOT FOR SALE, but is
worth in our opinion around $556,324
.
5010 Corporate Dr 313 is currently not for sale and is not an active listing on Listing.ca.
NEARBY SCHOOLS
Burlington Montessori Preschool
9,183.7 km
2111 Walker's Line, L7R3X5
Phone: (905) 332-1175
CSDCSO
9,185.0 km
2155 Birchleaf Lane, L7L6G8
Phone: (905) 331-6044
Halton Catholic District School Board
9,185.0 km
2400 Sutton Dr, L7L7N2
Phone: (905) 335-7553
Halton Waldorf School
9,183.7 km
2193 Orchard Rd, L7R3X5
Phone: (905) 331-4387
NEARBY SHOPPING CENTRES
Millcroft Shopping Centre
9,184.7 km
2020 Appleby Line, L7L6M6
Phone: (905) 319-9774
NEARBY PHARMACIES
Metro Pharmacy
9,184.7 km
2010 Appleby Line, L7L6M6
Phone: (905) 331-0060
Shoppers Drug Mart
9,184.7 km
2080 Appleby Line, L7L6M6
Phone: (905) 332-8787
NEARBY RESTAURANTS AND CAFETERIAS
Asano Sushi
9,184.7 km
2020 Appleby Line, L7L6M6
Phone: (416) 266-4533
NEARBY COFFEE SHOPS
Coffee Culture
9,184.7 km
1960 Appleby Line, L7L6M6
Phone: (905) 335-0050
Delymark Cafe
9,182.3 km
1100 Burloak Dr, L7L6B2
Phone: (905) 874-1515
Tim Hortons
9,183.7 km
1900 Walkers Line, L7R3X5
Phone: (905) 331-1426
Williams Coffee Pub
9,184.7 km
2070 Appleby Line, L7L6M6
Phone: (905) 319-0968
NEARBY BANKS
TD Canada Trust
9,187.1 km
2931 Walker's Line, L7M4M6
Phone: (905) 332-3550
TD Canada Trust
9,184.7 km
G1-2000 Appleby Line, L7L6M6
Phone: (905) 332-2240
NEARBY LIQUOR STORES
LCBO
9,184.7 km
1F-2000 Appleby Line, L7L6M6
Phone: (905) 336-6200