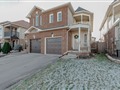
5133 Lampman Ave
$886,931
Comparative Market Analysis
Jun 14, 2025
NOT AN ACTIVE LISTING
Historical Performance
| Period | $ Change | % Change |
| 1 Day | +$447 | +0.050% |
| 7 Days | +$974 | +0.110% |
| 30 Days | -$1,283 | -0.144% |
| 3 Months | -$4,152 | -0.466% |
| 6 Months | +$11.2k | +1.28% |
| 1 Year | -$45.2k | -4.85% |
| 3 Years | +$137k | +18.3% |
| 5 Years | +$254k | +40.1% |
| 10 Years | +$504k | +132% |
List My Property
Real Estate Statistics
Financing Solutions
Browsing History
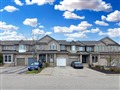
2177 Sutton Dr, Burlington
1 second ago
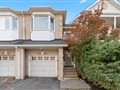
681 Lomond Cres, Burlington
3 seconds ago
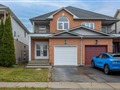
4208 Fuller Cres, Burlington
4 seconds ago
5847 Page Cres, Burlington
5 seconds ago
2401 Sutton Dr, Burlington
6 seconds ago
3324 Gravenstein Rd, Burlington
7 seconds ago
3342 Mikalda Rd, Burlington
8 seconds ago
675 Ardleigh Cres, Burlington
9 seconds ago
663 Cedar Ave, Burlington
10 seconds ago
302 Gardenview Dr, Burlington
10 seconds ago
AS SEEN ON


Are You a Licensed Real Estate Agent or Broker?